Imagine being able to predict the next move of your favorite coin.
Like waking up in the morning, opening a chart, adding a couple of basic indicators, and confidently saying:
“Huh, there's a high chance we’ll go up for another 2–3 days, and then I expect a reversal. I’ll open a position in Bitcoin now and close it when the price reaches X. Then, I’ll consider entering a short.”
All this, without opening Twitter, watching YouTube videos, or listening to what Trump has to say.
If that’s exactly what you’ve been trying to learn, then let’s start from zero.
The first step is to open a blank BTC/USDT chart on TradingView. Start with a clean chart — no indicators, just candlestick movements on the 2-hour timeframe.
Master, these candlesticks look random to me. What’s next?
Now it's time to apply some indicators to guide your direction. Let’s start with the most common ones: RSI and MACD.
RSI (Relative Strength Index)
RSI is a tool that indicates whether Bitcoin may be overbought or oversold.
Above 70: May mean it’s overbought – price could drop soon.
Below 30: May mean it’s oversold – price might rise.
Traders use RSI to spot possible reversals or confirm trends.
MACD (Moving Average Convergence Divergence)
MACD helps spot momentum and trend changes by comparing moving averages.
A bullish signal happens when the MACD line (blue) crosses above the signal line (orange).
A bearish signal is when it crosses below.
The MACD histogram shows the strength of the move.
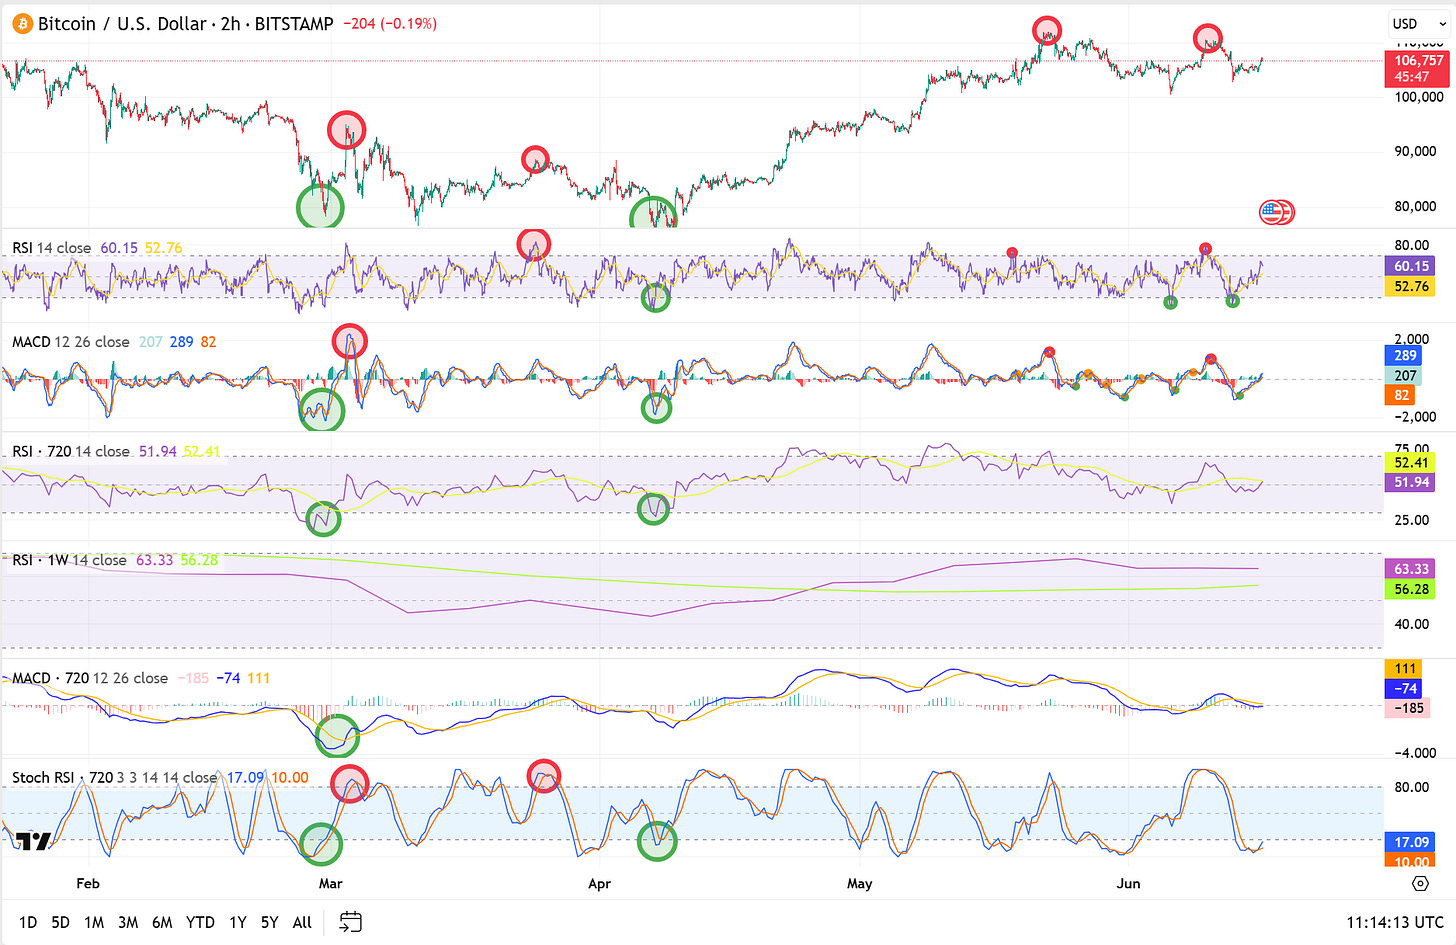
After applying both indicators, here’s what the chart reveals:
Let’s Analyze
RSI went above 70 twice, suggesting an overbought market. On the same day, MACD signaled bearish momentum as the MACD line crossed below the signal line.
However, on May 19, the price only reversed for a day before continuing upward, reaching a local top on May 22.
If you sold based on those signals, you missed out on a 6% gain over the next 3 days.
Later, MACD signaled a local bottom on May 23, giving a much better signal to stay in the trade — and it was correct.
Between May 26 and June 3, MACD gave several conflicting signals, leading to “noise” and potential losses if followed blindly.
The Problem with Single Timeframe Indicators
Relying on indicators from just one timeframe (like the 2-hour or daily) often leads to false signals and missed context. Common issues include:
One timeframe shows overbought or bullish, while the larger trend is bearish.
RSI and MACD might disagree.
MACD might signal bullishness, while RSI flashes overbought.
Lower timeframes generate too much noise in volatile markets.
The Solution?
Apply RSI & MACD on multiple timeframes. Also, add a third indicator for better confluence: Stoch RSI.
This setup might look more complex, but it offers deeper insight for better decision-making.
After applying RSI (12H & Weekly), and MACD + Stoch RSI (12H), here’s what we find:
Best entries: February 28 and April 7 — confirmed by Stoch RSI, MACD (12H & 2H), and RSI (12H & 2H).
Best exits: March 3, March 24, May 22, and June 10.
Weekly RSI didn’t add much — stayed between 50–65 (neutral zone).
Some signals (like the sell on May 18) can be safely ignored if not confirmed by higher timeframes.
These results look much cleaner. But why don’t we just trade with them?
The Harsh Truth
Even combining RSI & MACD across 2–3 timeframes gives inconsistent results, with a win rate of only ~50%.
In bearish markets, performance drops even further.
Being consistently profitable using just these indicators is nearly impossible long-term.
Master, I know you’re smart. What’s a better alternative?
A Smarter Setup
Here’s a more reliable combo that doesn’t overload you with complexity — and delivers a 70%+ win rate:
Keep reading with a 7-day free trial
Subscribe to Strategy Master to keep reading this post and get 7 days of free access to the full post archives.


