Alright, I tried not to make the title sound clickbaity, but this article is exactly about that — a strategy for the crypto market with a high win rate that doesn’t require you to sit at your laptop every day trading.
Master, will you talk about your Cycle Strategy again?
The opposite.
Today, we’re talking about shorting.
Shorting is a concept where you’re betting the price of an asset will go down instead of up.
Sounds simple?
In reality, it is simple — but very few people actually do it.
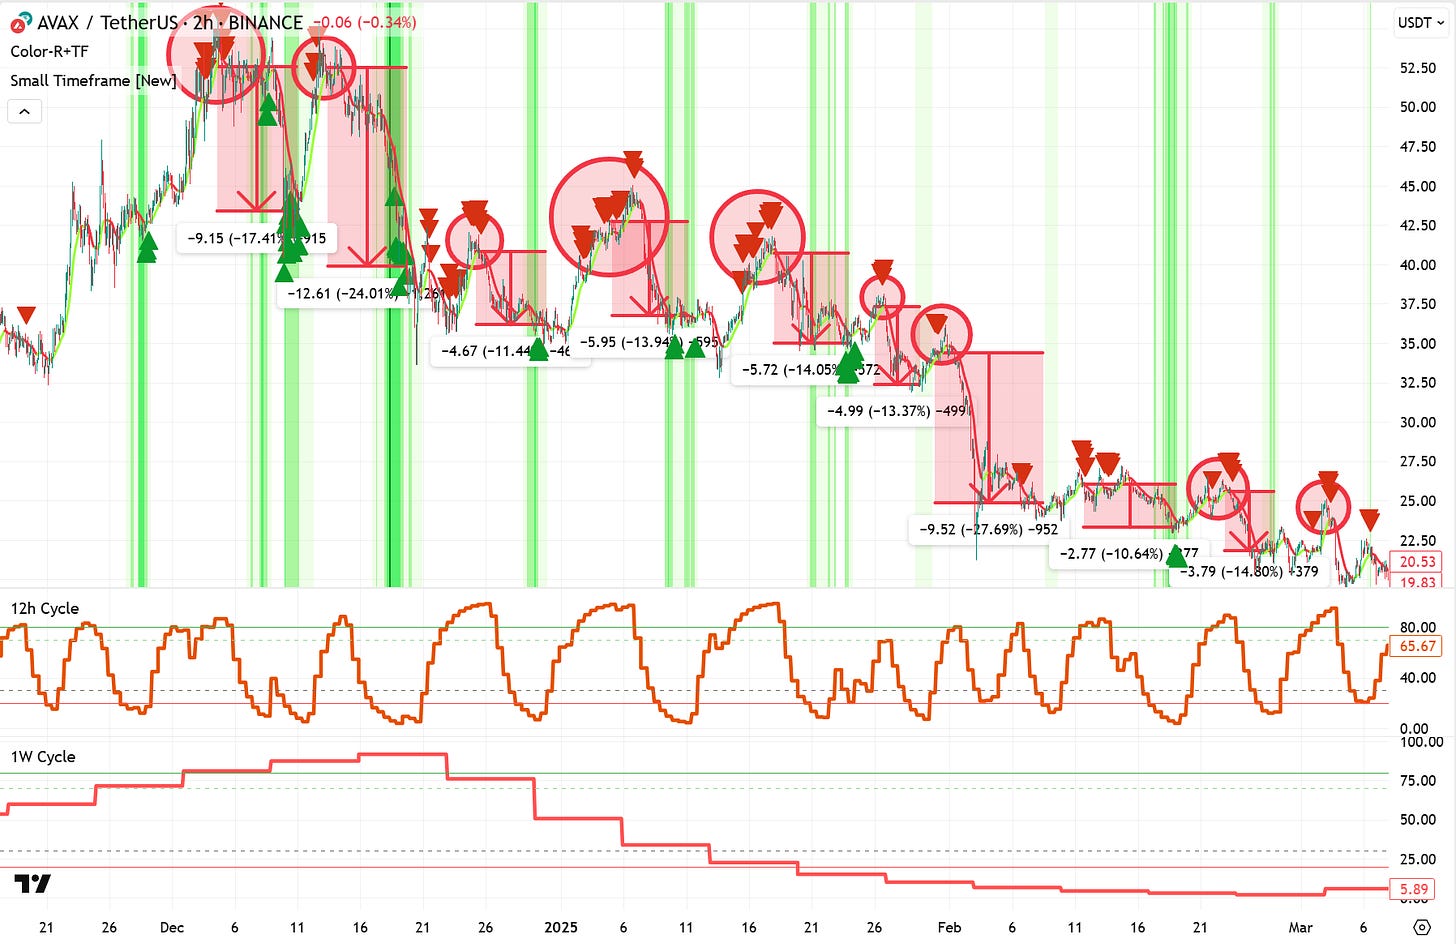
Take a look at this chart:
Does the chart look complicated? Let me break it down:
At the bottom, you’ll see two Cycle Indicators - the top one is the 12-hour cycle, showing projected price action for the next ~5 days. Below that is the 1-Week Cycle Indicator, giving a longer-term projection (~1 month).
At the top, you see the 2-hour AVAX/USDT chart, with Sell signals from the Small Timeframe strategy. Red triangles = Sell signals, green arrows = Buy signals.
The red arrows (inside the red rectangle) show the gains you would’ve made if you had shorted AVAX at a Sell signal - provided the 12-hour Cycle was above 85 and the 1-Week Cycle was falling.
Conclusion: Every single trade would’ve yielded at least 10% profit, without leverage.
Wait, Master, can we short tokens using Cycles?
Yes! In fact, shorting in crypto is often less risky — because the truth is, altcoins (excluding ETH) are falling most of the time.
Take a look at the DOT/USDT chart from the last 3 years.
Looks messy? Let me break it down:
You're looking at a 3-day chart, showing the last 3 years of price action.
At the bottom, there's a 2-Week Cycle Indicator showing the long-term trend. (Not super important here — just included it so you can appreciate how accurate it is 😄)
Above the chart, blue arrows show the four periods when DOT was going up:
51 days in early 2023
72 days at the end of 2023
57 days in early 2024
36 days at the end of 2024
That’s 216 days total. Out of 1,201 days, DOT was in an uptrend only ~18% of the time.
Now look at the downtrend periods:
278 days in 2022
237 days in 2023
32 and 243 days in 2024
195 days (and counting) in 2025
That’s 985 out of 1,201 days, meaning DOT was falling ~82% of the time.
The same applies to many other altcoins — LINK, TON, HBAR, AAVE, RENDER, ICP, and 99% of others.
Master, teach me shorting right now! How can I start making money with shorting?
Keep reading with a 7-day free trial
Subscribe to Strategy Master to keep reading this post and get 7 days of free access to the full post archives.


