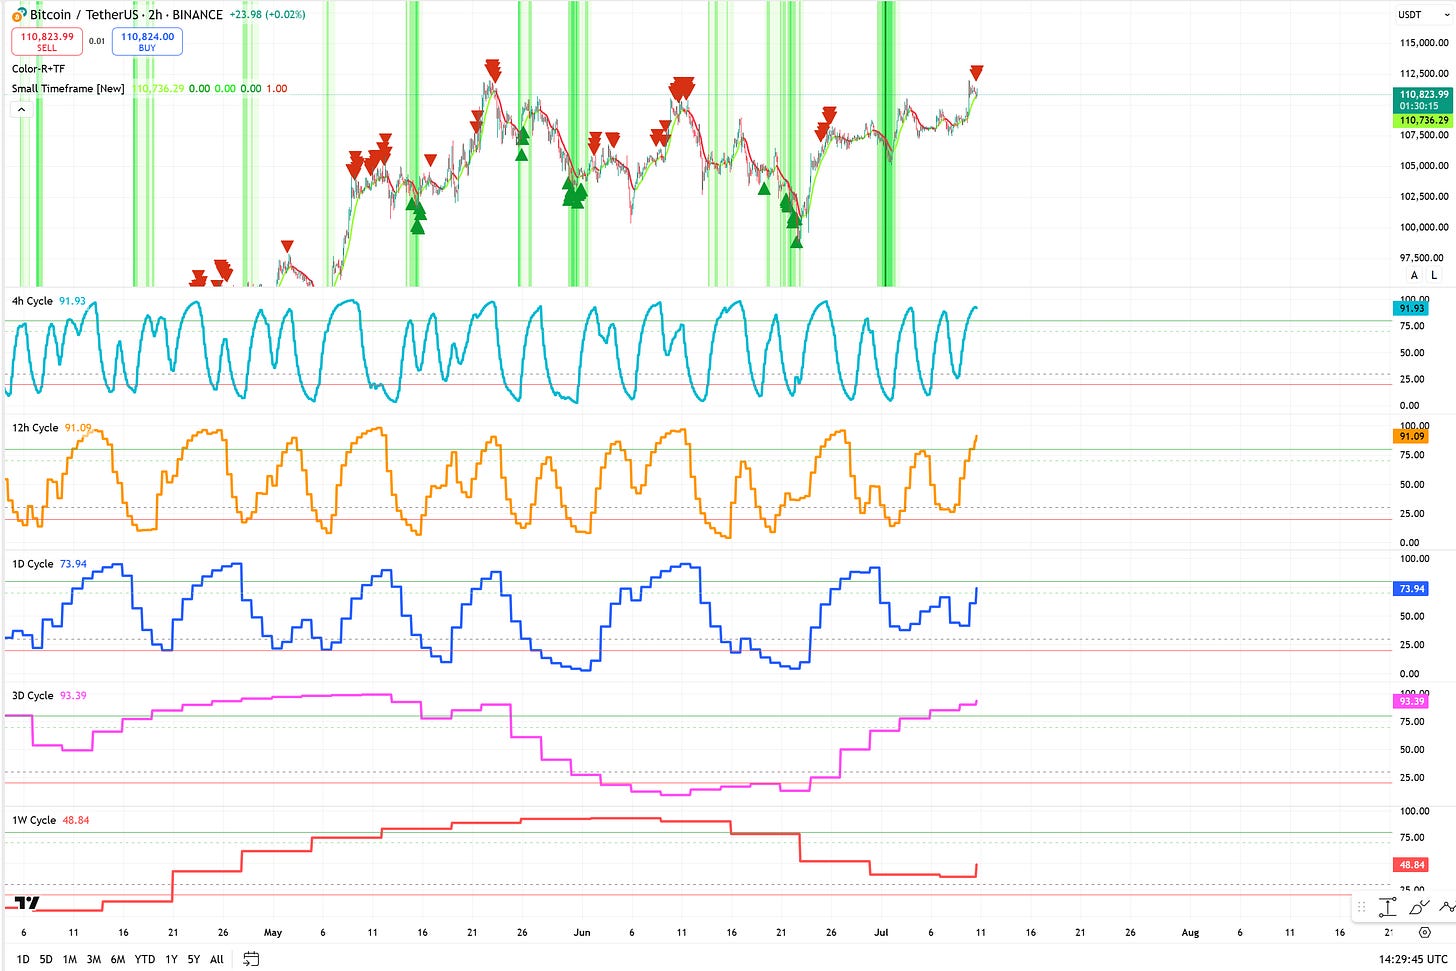
People are congratulating each other on Twitter for the new all-time high. Altcoins are pushing forward, but the question remains — how can you capitalize on this the most?
Sure, you're probably holding some Bitcoin and altcoins, and your portfolio jumped 10–15% overnight. Congratulations!
But now you’re thinking about throwing more money into the market.
You hesitate for a moment...
Are we going straight to $150K, followed by an unstoppable altseason, or…?
Looking at this chart without any indicators would be extremely complicated.
Bitcoin just broke its all-time high — sentiment is undeniably positive. Seeing green PnL cards adds more confluence that you're doing something right.
Twitter influencers? Bullish.
YouTubers? Bullish.
History?
Well… kind of bullish. Once we break all-time highs, we usually keep climbing - especially in the third year of a bull market.
With all that, you’ve built enough confluence to keep holding, and maybe even invest in another altcoin.
Now you can’t wait for prices to rise - you’re already thinking about taking profits.
But the question is…
When will you sell?
If your goal is to double your money, Bitcoin likely won’t reach $220K just yet, so that might not work.
When is enough, enough?
Having a Strategy
Once you have a strategy you consistently follow, two things happen:
You become far less emotional about all-time highs or 30% retracements.
You start understanding the market, and can explain moves using your own system.
You’re not just reacting — you’re planning probabilities for the next move. You no longer care about Twitter threads or YouTubers’ videos. You do your own analysis — just five minutes with the chart.
And if you have Buy & Sell Signals on TradingView, you barely need to monitor the chart. You just get notifications on your phone whenever a signal fires.
Simple, easy, and profitable.
Enough theory, Master. What’s your Bitcoin outlook for the next 2 months?
To analyze Bitcoin’s mid-term direction, we’ll look at 3 Cycle Indicators:
3-Day Cycle (pink line): Already preaching a top. It could stretch another 9 days, but only if the price accelerates. More likely, a top forms by Monday, followed by a correction next week.
1-Week Cycle (red line): Just reversed to the upside and looks strong. If this holds, we could see 4 more weeks of positive price action.
2-Week Cycle (electric line): Very bullish territory. This is where explosive moves usually occur. But timing is key - this momentum needs to happen now. By late August and September, both the 1-Week and 2-Week cycles are expected to turn down, opening great shorting opportunities.
Thanks for the explanation, but what trades should I take to maximize profits now?
To find the exact entries, let’s check the 2-hour Bitcoin chart...
Keep reading with a 7-day free trial
Subscribe to Strategy Master to keep reading this post and get 7 days of free access to the full post archives.


